Volatility & the Greeks
Volatility can be a very important factor in deciding what kind of options to buy or sell. Historical volatility reflects the range that a stock’s price has fluctuated during a certain period. We denote the official mathematical value of volatility as "the annualized standard deviation of a stock’s daily price changes."
There are two types of volatility: statistical volatility and implied volatility.
Statistical (Historical) Volatility is a measure of actual asset price changes over a specific period.
Implied Volatility is a measure of how much the marketplace expects asset price to move for an option price. That is, the volatility that the market implies.
Volatility is difficult to compute mathematically. A strategist can let the market compute the volatility using implied volatility. This is similar to an efficient market hypothesis which states that if there is enough trading interest in an option that is close to at-the-money, that option is priced fairly.
The Black-Scholes Formula
The Black-Scholes formula was the first widely used model for option pricing. A strategist can use this formula to calculate theoretical value for an option using current stock prices, expected dividends, the option's strike price, expected interest rates, time to expiration and expected stock volatility. While the Black-Scholes model does not perfectly describe real-world options markets, it is still often used in the valuation and trading of options.
Variables of the Black-Scholes formula are:
- Stock Price
- Strike Price
- Time remaining until expiration expressed as a percent of a year
- Current risk-free interest rate
- Volatility measured by annual standard deviation
The Greeks
The Greeks are a collection of statistical values that give the investor a better overall view of option premiums change given changes in pricing model inputs. These values can help decide what options strategies to use. The investor should remember that statistics show trends based on past performance. It is not guaranteed that the future performance of the stock will behave according to the historical numbers. These trends can change drastically based on new stock performance.
Beta is a measure of how closely the movement of an individual stock tracks the movement of the entire stock market.
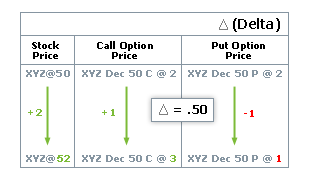
Delta is a measure of the relationship between an option premium and the underlying stock price. For a call option, a Delta of .50 means a half-point rise in premium for every dollar that the stock goes up. For a put option contract, the premium rises as stock prices fall. As options near expiration, in-the-money contracts approach a Delta of 1.00.
Gamma is the sensitivity of Delta to a one-unit change in the underlying. Gamma indicates an absolute change in Delta. For example, a Gamma of 0.150 indicates the Delta increases or decreases by 0.150 if the underlying price increases or decreases by $1.00. Results will usually not be exact.
Lambda is a measure of leverage, the expected percent change in an option premium for a 1% change in the value of the underlying product.
Rho is the sensitivity of option value to change in interest rate. Rho indicates the absolute change in option value for a 1% change in the interest rate. For example, a Rho of .060 indicates the option's theoretical value increases by .060 if the interest rate decreases by 1.0. Results may not be exact due to rounding.
Theta is the sensitivity of an option’s premium to change in time. Theta indicates an absolute change in the option value for a one-unit reduction in time until expiration. Theta may be displayed as a 1-day or 7-day measure. For example, a Theta of -.250 indicates the option's theoretical value changes by -.250 if the days to expiration reduce by seven. Results may not be exact due to rounding. NOTE: seven day Theta will change to one day Theta if days to expiration are seven or less (see Time decay).
Vega is the sensitivity of option value to changes in implied volatility. Vega indicates an absolute change in option value for a 1% change in volatility. For example, a Vega of .090 indicates the option's theoretical value increases by .090 if the implied volatility increases by 1.0%. Alternately, the option’s theoretical value decreases by .090 if the implied volatility decreases by 1.0%. Results may not be exact due to rounding.